
Introduction
My first encounter with the Pitchfork lines goes back a few decades ago when I just started my career in trading the financial markets and more precisely experimenting with technical analysis. I found the subject so interesting that I read many books over a very short period in the quest to “build’ my own trading system. Admittedly, I went through all the learning phases and emotional ups and downs until I found the long-awaited “holy grail”. No, it was not the Pitchfork theory but the invaluable concept of the trend. When reading about trends, the support and resistance notion usually pops up as well. It is certainly a big area for technical analysis that no one can ignore, beginners and veteran traders alike. Dr. Alan Andrews delved into the subject in the 1960s and developed the Median Line theory, based on the idea that prices return sooner or later to the median.
Pitchfork, Bollinger Bands, Moving Average
Well, it is not a coincidence that a lot has been written about the Moving Averages, Channels, and Bollinger Bands. The Pitchfork or Median Line shares similar beliefs, trend is the boss. In a trending market, prices do not move in a straight line but rather they follow a zigzag path. This is one of the key characteristics of the trend. Peaks and troughs or if you prefer tops and bottoms. The Median Line just like the Moving Average attracts prices to it just like a “mega-magnet”. Prices move on the line only to deviate from it for a period but eventually they return to it.
Andrew’s Pitchfork
Andrew’s Pitchfork
Andrew’s Pitchfork
Plotting the Median Line
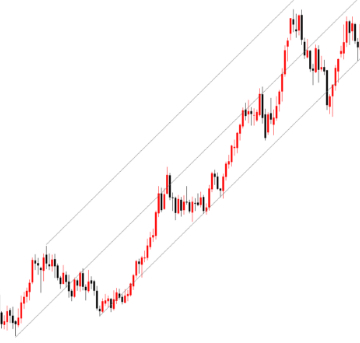
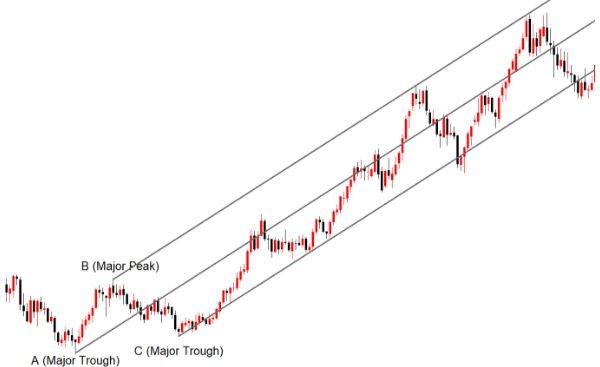
Drawing the Andrew’s Pitchfork is as easy as ABC. So, three points are needed. For an uptrend select a major trough (i.e. bottom) at the beginning of the trend. Then, a major peak (i.e. top) followed by a subsequent major trough.
The Media Line begins at point A the first major trough selected and runs through the middle of points B and C. Additionally, two parallel lines are drawn passing through point B at the top and point C at the bottom. Dr. Alan Andrews believed that most of the time, prices will return to the Median Line. This implies that when the price hits the lower trendline (i.e. lower line passing through point C), there is a probability, high according to Dr. Andrews, to bounce up to the Median Line. A long position at the lower trendline supported by an oversold reading on your oscillator along with a Candlestick reversal may be a potential setup to follow. The Median Line may be considered as a potential profit target since the price is expected to return to it.
A short position at the upper trendline supported by an overbought reading on your oscillator along with a Candlestick reversal pattern may be a potential setup to follow. The price target may be seen at the Median Line.
Conclusion
Well, I am sure that by now you have realized the resemblance of the Median Lines with other technical analysis tools and how they lend themselves to the concept of support and resistance. All three lines may be seen as potential support and resistance areas.
It is up to you, the trader, to find the confluence of signals to pull the "trigger".