
About the author
Andreas Thalassinos, is a respected educator and Certified TechnicalAnalyst. He is a recognized authority in the financial markets industry,and renowned for his expertise in algorithmic trading. After years ofconsulting with many forex brokers on a number of key projects, Andreasofficially returned to the company that he founded and is the principaldriver and architect of FxWizards’ extensive educational programme. Hisinternational seminars and workshops provide clients across the worldwith on-location support, while his webinars, e-books, educational articlesand videos form the cornerstone of FxWizards’ multilingual, open accesstraining resources.
The training is tailored to traders’ needs by region and experience level.Thalassinos has played a key role in the development of financial marketseducation within the industry, training tens of thousands of traders andprofessionals around the world. Traders of all levels value his seminars andworkshops for both content and his passionate and lively presentations.Andreas also plays a pivotal role in FxWizards’ research and developmentteam. In this capacity, he led the development of the FxSwingWizard, VIPTrading Signals, FxWizards Pivot Points Strategy, Currency Strength Meterand Currency Correlations tools, which are designed to help traders spotpotential trading opportunities across various trading instruments.
Thalassinos has been awarded a number of international professionalcertificates including: MSTA by the Society of Technical Analysts (UK)and CFTe and MFTA by the International Federation of Technical Analysts(USA) – the highest qualification in the technical analysis community.
He also holds a BSc and MSc in Computer Science from the University ofLouisiana at Lafayette and Bowie State University, respectively.
His latest research thesis is titled “Anatomy of a living trend: Swing charts,High Points and Low Points, Peaks and Troughs and how their underlyingstructure may define their forecasting strength.”
He currently travels around the globe, appearing as guest speaker onnumerous seminars, conferences and workshops.

Introduction
Welcome to the wonderful world of the financial markets! Since you are reading this, I assume that you have a great interest in tradingthe markets, and you would like to explore some popular trading strategies. All strategies in this ebook are based on technical analysisprinciples and concepts. The technical analysis approach primarily studies the price charts to identify the underlying trend and unveilsits reversal in the opposite direction at an early stage. After all, it is all about timing! Volume, where available, plays an importantleading role as it confirms the price action. In some of the strategies, filtering has been employed as well to filter out the less probablesetups. Furthermore, technical analysis studies the market psychology so you can have a timely entry into the markets.

Inverse Head & Shoulders
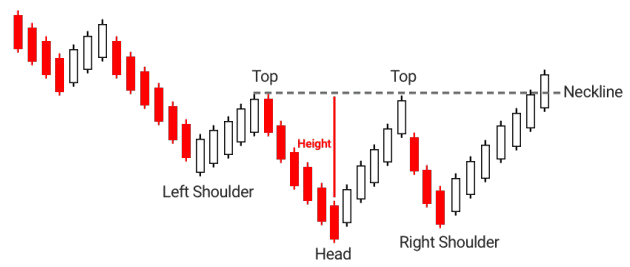
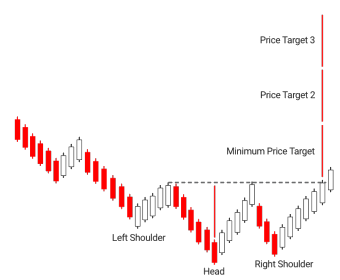
Perhaps, one of the most popular and more reliable technical trading strategies inthe financial markets is the Inverse Head and Shoulders. It is a chart reversal patternidentified at the bottom of the trend signaling the end of the established trend and thebeginning of a new trend in the opposite direction.
It consists of three bottoms where the lowest bottoms, the middle one, is called the Head, the highestbottom to the left is the Left Shoulder and the highest bottom to the right resembles the Right Shoulder.Additionally, there are two rallies, corrections if you prefer, that form the corresponding two tops. The line thatconnects the two tops is called the Neckline. A decisive breach of the neckline completes the Inverse Headand Shoulders pattern and opens the way for a new trend to the upside.
Requirement
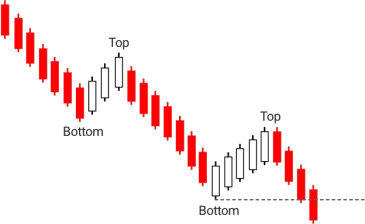
A prerequisite of any reversal pattern is theexistence of an established trend. An downtrendis defined as a sequence of successively lowertops and lower bottoms. Some trends are longerthan others but as a minimum requirement atleast two consecutive lower tops and lowerbottoms are required and the price falling belowthe second bottom.
Warnings
Several warnings may appear alerting of theimpending formation of the Inverse Head andShoulders:
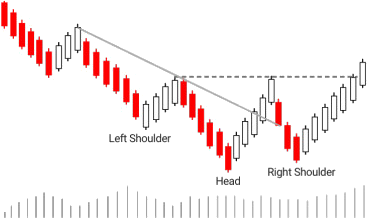
- The dip to the lowest bottom, that is, the Head,is on a lighter volume compared to the volumeof the Left Shoulder. This may be a hint that thedowntrend is running out of steam.
- The correction from the Head up to the Necklinerallies past the Left Shoulder. Volume is heavierthan usual, demonstrating the buyers’ intentions.Furthermore, the correction breaks above theuptrend line.
- Subsequently, the next dip fails to fall belowthe previous bottom (i.e. Head), and the RightShoulder is formed instead.
- Eventually, the price rallies higher decisivelyviolating the Neckline on higher volume. It is asignal that the downtrend has ended and a newtrend in the opposite direction has just begun.
Price Targets
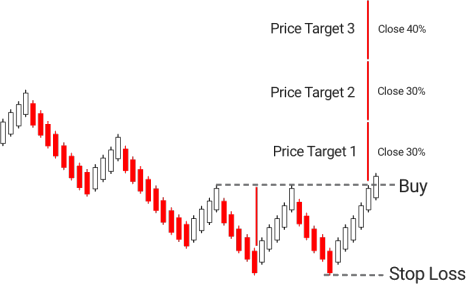
The first price target also known as the MinimumPrice Target is measured equal to the Height(distance from the Head to the Neckline)projected from the point where the Neckline wasbreached.
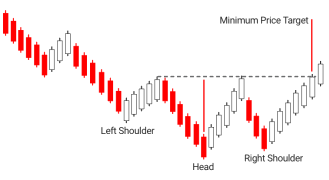
The second price target, Price Target 2, may beestimated at twice the Height where the thirdtarget, Price Target 3 is computed at three times.
Fibonacci fans usually calculate the second target,Price Target 2, at a distance equal to 2.618 of theHeight of the structure. The third, Price Target 3 isestimated at 4.236 of the Height. Other variationsalso exist to suit the trader’s profile.
Entry
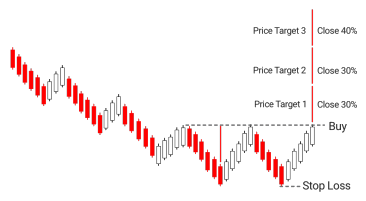
Place a Buy order above the Neckline.
Stop Loss
Place a protective Stop Loss below the Right Shoulder.
Take Profit
Close part of the position at:
- Price Target 1 - 30%
- Price Target 2 - 30%
- Price Target 3 - 40%
Note that percentages may vary to suit one’s risk management rules.

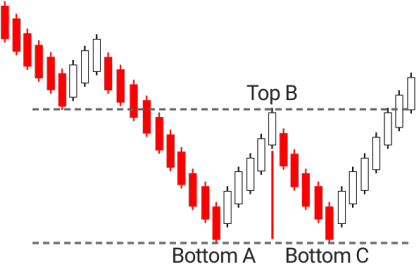
Triple Bottom
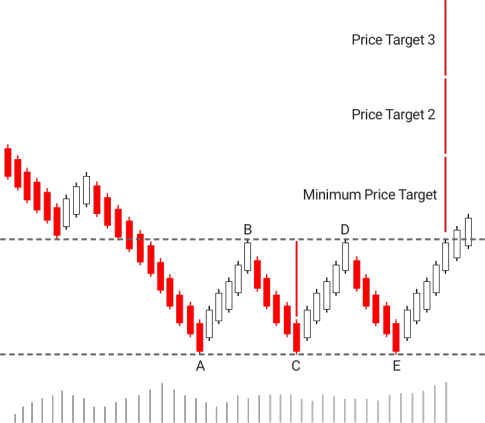
A very similar pattern to Inverse Head and Shoulders where all three bottoms areabout the same price level. The volume will give hints for the impending reversal as itwill be lighter on the dib to each bottom. Unless, the price breaks decisively above theresistance level connecting the bottoms, B and D, the Triple Bottom is not complete.
Requirement
An established downtrend is a prerequisite before identifying a Triple Bottom reversal.
Warnings
- The decline to the second bottom, Bottom C,is on a lighter volume compared to the volumeto the previous bottom to the left, Bottom A. Thismay be a hint that the bears are running out ofsteam.
- Bottoms C and E fail to fall below Bottom A,a sign that the bulls started entering the marketwith long positions.
- The corrections from Bottom A to Top B andBottom C to Top D may be on a heavier volumethus giving hints for the buyers’ inventions.
- Eventually, price breaks the resistance lineconnecting Tops B and D decisively on a highervolume. It is a signal that the downtrend hasended and a new trend in the opposite directionhas just begun.
Price Targets
The first price target, also known as the MinimumPrice Target, is measured equal to the Height(distance from Bottom A to the resistanceconnecting Tops B and D) projected from the pointwhere the resistance was breached. The secondprice target, Price target 2, may be estimated attwo times the Height where the second target,Price Target 3 is computed at three times.
Fibonacci fans usually calculate the secondtarget, Price Target 2, at a distance equal to 261.8% of the Height of the structure. The third,Price Target 3 is estimated at 423.6% of theHeight. Other variations also exist to suit thetrader’s profile.
Entry
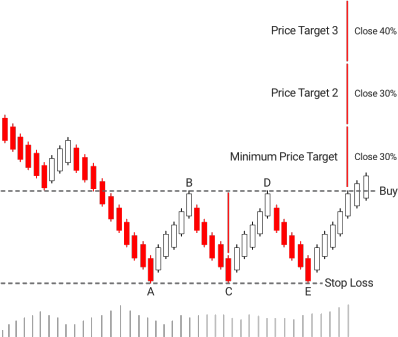
Place a buy order above the resistance connecting the two tops, B and D.
Stop Loss
Place a protective Stop Loss below of the pattern.
Take Profit
Close part of the position at:
- Price Target 1 - 30%
- Price Target 2 - 30%
- Price Target 3 - 40%

Double Bottom
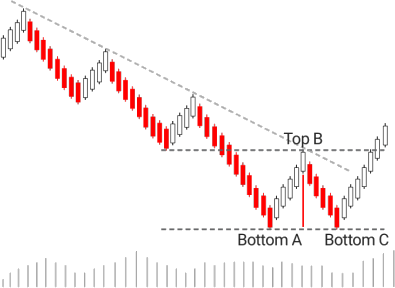
One of the easiest to identify and more frequently occurring reversal pattern is theDouble Bottom. It is another variation of the popular Inverse Head and Shoulders. Itis a chart reversal pattern spotted at the end of the downtrend signaling the end ofthe prevailing trend and the very beginning of a new trend in the opposite direction,uptrend.
The Double Bottom formation consists of two bottoms at about the same price level and a top. The pattern is considered complete when Top B is breached decisively.
Requirement
A prerequisite of the Double Bottom reversal pattern is the existence of an established downtrend.
Warnings
Several warnings may appear alerting for theimpending formation of the Double Bottom:
- The second bottom, Bottom C, fails to fall belowthe previous bottom signaling the weakness ofthe sellers to maintain the momentum to thedownside.
- The decline to the second bottom, that is,Bottom C, is on a lighter volume compared to thevolume to Bottom A. This may be a hint that thesellers are running out of steam.
- The rally from Bottom C usually breaks abovethe downtrend line.
- The rally from Bottom C to the resistance at TopB is accompanied by a heavier volume. This is ahint that the buyers are entering the market.
- Finally, the penetration of the resistance level atTop B on a high volume completes the pattern.It is a signal that the downtrend has ended anda new trend in the opposite direction has justbegun.
Price Targets
The first price target also known as the MinimumPrice Target is measured equal to the Height(distance from the Bottom to the Neckline)projected from the point where the Neckline wasbreached. The second price target, Price target 2,may be estimated at two times the Height wherethe second target, Price Target 3 is computed at three times.
Fibonacci fans usually calculate the secondtarget, Price Target 2, at a distance equal to 2.618of the Height of the structure. The third, PriceTarget 3 is estimated at 4.236 of the Height. Othervariations also exist to suit the trader’s profile.
Entry
Place a Buy order above the resistance level, at Top B, that was violated.
Stop Loss
Place a Protective Stop Loss below of Bottom A.
Take Profit
Close part of the position at:
- Price Target 1 - 30%
- Price Target 2 - 30%
- Price Target 3 - 40%

Double Crossover
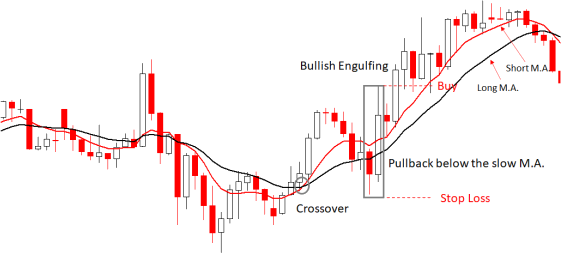
A very popular strategy among traders is the combination of two moving averages, a slow and a fast or a short and long if you prefer. There are many combinations out there but in the scope of this eBook let’s take a look at the 10 and 20 periods. What is left to decide is the moving average method of calculation. It is no secret that I personally like the Linear Weighted Moving Average.
In a Double Crossover system, a buy signal is generated when the short moving average crosses above the long moving average line. In the quest to reduce false signals, this strategy suggests waiting for a pullback below the slow moving average and buying at the next Bullish Engulfing Pattern.
Remember that a Bullish Engulfing pattern is a two-candlestick reversal pattern at the end of downtrend or a decline. The first candle is a black candlestick (ideally small). The second is a long white candle that opens below the prior close and subsequently closes above the open of the previous black body. It signals the shift of the sentiment and the impending reversal to the upside.
Requirement
The existence of a downtrend, shown as prices hovering below both the short and the long Moving Averages.
Price Targets
The first price target (Price Target 1) is estimated at 161.8% of the Bearish Engulfing pattern. The second target (Price Target 2) is computed at 261.8% of the pattern. The final target (Price Target 3) is seen at the close below the long Moving Average. Of course, different combinations may apply to suit the trader’s profile.
Entry
- Identify a crossover between the WMA (10) and WMA (20).
- Wait for a pullback below the WMA (20), the long Moving Average.
- Spot a Bullish Engulfing pattern.
- Place a Buy order above the Bullish Engulfing pattern.
Stop Loss
Place a protective Stop Loss below the Bullish Engulfing pattern.
Take Profit
Close part of the position at:
- 261.8% - 50%
- 423.6% - 30%
- At a close below the WMA (20) – 20%

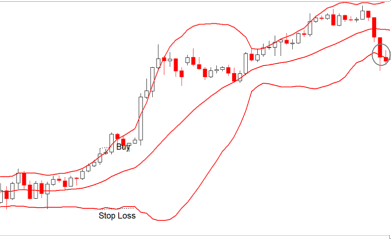
Bollinger Bands
A very popular technical tool among traders of all skill levels.
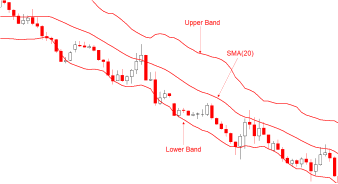
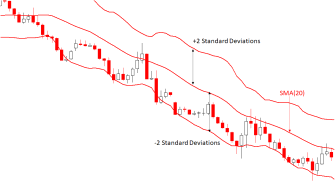
It consists of a 20-period Simple Moving Average (SMA) and two bands. The Upper band is constructed by adding two standard deviations above the SMA while the Lower band is calculated by subtracting 2 standard deviations below the SMA. Bollinger Bands:
- Measure market volatility
- Identify the trend
- Spot continuation of the prevailing trend
- Detect overextended prices
- Identify a reversal in the market
Volatility
Bollinger Bands measure market volatility. During high volatility, the bands widen whereas in low volatility the distance between the bands is narrow. Usually, periods of low volatility are followed by periods of high volatility and vice versa.
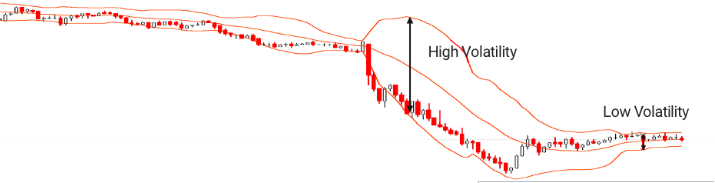
Low volatility is characterized by the narrowing of the bands, that is the Upper and Lower Bands.
The Squeeze
In periods of low volatility, the price action is confined to a narrow range called the Squeeze.
Trading the Squeeze is one of the popular methods using the Bollinger Bands as after a Squeeze an expansion of the bands is imminent. Basically, it is a range breakout strategy.
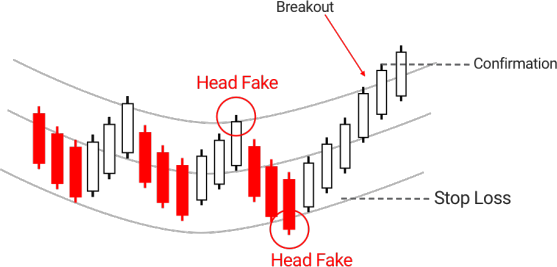
Head Fake
The Squeeze suffers from false breakouts called Head Fake. At times, a breakout may occur above the Upper Band only to find out in a while that prices fell in the opposite direction. The opposite is true as well. A breakout below the Lower Band may bounce off to the Upper Band. To minimize false breakouts, wait for a price confirmation before opening a position. A confirmation is nothing else but the next candlestick exceeding the high of the breakout candle for an upward breakout or falling below its low price in a downward breakout.
Entry
Place a Buy order above the high of the breakout candlestick.
Stop Loss
Place a Protective Stop Loss below the Lower Band.
Take Profit
Close all the positions at a close in the opposite direction below the Lower Band.

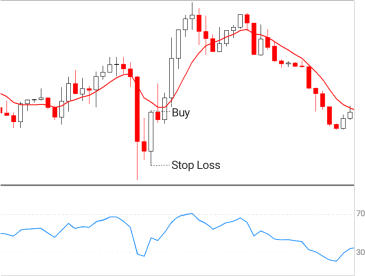
Weighted Moving Average with Bullish Engulfing filtered by Relative Strength Index
This is one of the first trading strategies that I came across when I started my trading career. It’s a straightforward strategy since it consists of a Moving Average and a Bullish Engulfing pattern. I also added filtering by a 9-period Relative Strength Index. The strategy suggests an entry to the upside once an Engulfing Bearish pattern closes above the 10-period Weighted Moving Average (WMA) and RSI (9) is in the Oversold area.
Remember that the Bullish Engulfing pattern is a two-candlestick reversal pattern at the end of an downtrend or a decline. The first candle is a black candlestick (ideally small) in the direction of the established trend. The second is a long white candle that opens below the prior close and subsequently closes above the open of the previous black body. It signals the shift of the sentiment and the impending reversal to the upside.
Requirement
The existence of an downtrend, shown as prices hovering below the Weighted Moving Average.
Price Targets
The first price target (Price Target 1) is estimated at 200% of the Bullish Engulfing pattern. The second target (Price Target 2) is computed at 300% of the pattern. The final target (Price Target 3) is seen at 400%. An immediate liquidation of the whole position is recommended at two consecutive closes below the WMA (10). Of course, different combinations may apply to suit the trader’s profile. Note that for the purpose of calculating the price targets, the High and Low price of the pattern is used.
Entry
Place a Buy order above the high of the Bullish Engulfing pattern.
Stop Loss
Place a protective Stop Loss below the low of the Bullish Engulfing pattern.
Take Profit
Close part of the position at:
- 200% - 50%
- 300% - 30%
- 400%
- Close the remaining position, if any, immediately after 2 consecutive closes below WMA (10)

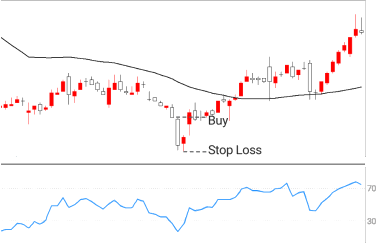
Simple Moving Average with Bullish Harami filtered by Relative Strength Index
This is another popular trading strategy that combines the Japanese Candlestick reversals, the Relative Strength Index as a filtering tool to gauge the extent of the decline while the Simple Moving Average serves as both an additional visual filtering tool and a final profit target.
This is another strategy that I experimented with, during the period when I developed a few trading robots. The parameters I selected were 50 periods for the SMA and the default, 14 periods, for RSI. The rest was straightforward. The identification of a Bullish Harami pattern below the SMA (50) triggers a warning. On a closer look, if the pattern is far below the SMA then the RSI is employed to confirm the reliability of the pattern. An oversold RSI will raise the confidence level. Consider buying when the next candle exceeds the high price of the Bullish Harami pattern. Place a protective stop loss at the bottom of the pattern. A Take-Profit strategy is heavily dependent on the trading profile of each individual:
- Close 50% of the position when price travels 100% the length of the pattern.
- Close the remaining 50% when the price touches the SMA (50).
- Other combinations may apply.
Requirement
The existence of downtrend is shown when prices hover above the Simple Moving Average..
Price Targets
The first price target is estimated at a distance equal to 100% of the Bullish Harami pattern. The final target is seen when the price reaches the Simple Moving Average. Of course, different combinations may apply to suit the trader’s profile. Note that for the purpose of calculating the price targets, the High and Low price of the pattern is used.
Entry
Place a Buy order above the high of the Bullish Harami pattern.
Stop Loss
Place a protective Stop Loss below the low of the Bullish Harami pattern.
Take Profit
Close part of the position at:
- 100% - 50%
- SMA (50) - Remaining 50%

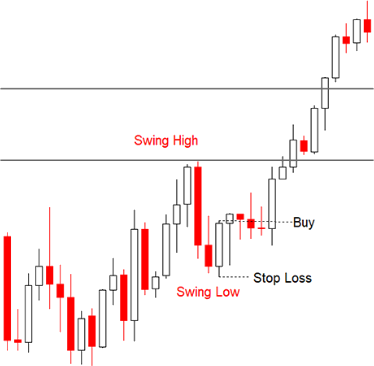
Marubozu At Support
Many traders, especially novices, experiment with Support and Resistance levels as an entry point. To be honest, I have never trusted support and resistance as they are associated with the range which, in my opinion, is unreliable. Nevertheless, I use the support during an uptrend. As you know the market does not move in a straight line. Instead, it follows a zigzag path. It rises in the direction of the uptrend and it dips in the opposite, downwards.
During the dip or correction, if you prefer, I look for a good excuse to buy near the support area. The advantage is twofold. The trade is in the direction of the established trend which is crucial and second, as you will find out, the risk is relatively low. The presence of a long white candle (Marubozu) or any other Japanese reversal pattern, near the support area will signal the strength of the buyers to pull the market higher. A protective stop loss is seen at the bottom of the pattern. Potential profit targets are subjective. I prefer to close 50% at the top of the current swing high and the remaining at a distance equal to 161.8% of the swing.
Requirement
The formation of a white Marubozu near the support an area during a correction of a uptrend.
Price Targets
The first price target, 50% of the position, is estimated at the top of the current swing high. The remaining is seen at a distance equal to 161.8% of the current swing.
Entry
Place a Buy order above the high of the white Marubozu.
Stop Loss
Place a protective Stop Loss below the low of the pattern.
Take Profit
Close part of the position at:
- 100% - Close 50%
- 161.8% - Close remaining 50%
Conclusion
These are some popular bullish trading strategies among many others. They combine a wide range of key technical analysis principles, concepts, and indicators. It is a good starting point for beginners and a refresher for experienced traders. Save them in your trading arsenal and practice with them until you decide which ones are for you. Devote enough time to them until you master them. The Technical Analysis will show the way. Happy trading!

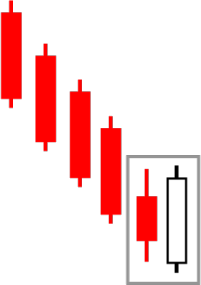
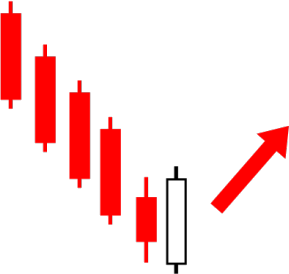
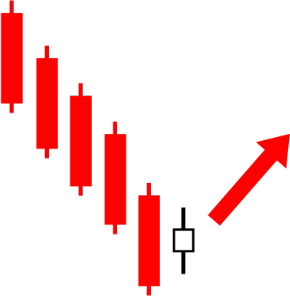
Bullish Engulfing
The Bullish Engulfing pattern appears at the bottom of downtrend or decline. It consists of two candlesticks. The first is a bearish, black, smaller sized candle. The second is a long white candle signifying the strength of the buyers. The white body contains the body of the first candle.
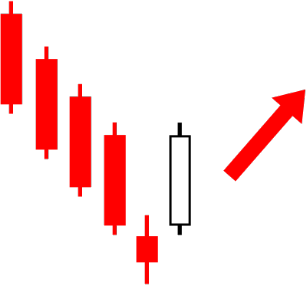
Morning Star
The Morning Star pattern consists of three candles occurring at the bottom of a downtrend. The first is a long black candle followed by a small body of either color that gaps down. The small body signifies indecision which is a warning that the sellers are losing momentum. The third candle consists of a long white body that closes well into the body of the first black candlestick.
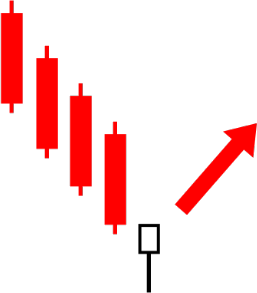
Hammer
The Hammer appears at the bottom of a decline indicating indecision among the traders. It consists of a small body of either color that gaps lower than the previous candle. The long lower shadow is an alert of the sellers’ failure to maintain the low prices.
Bullish Harami
This is a two-candlestick reversal pattern formed at the bottom of a decline signaling an impending reversal. The first is a long black candle in the direction of the trend. The second is a small body of either color, indicating indecision, opening, and closing within the body of the previous long black body.
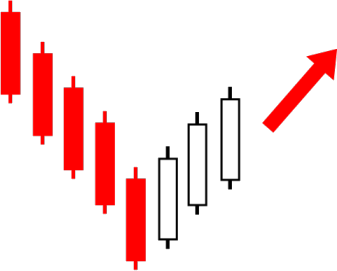
Three White Soldiers
The Three White Soldiers pattern is a strong signal that the buyers are in control. It consists of three long white candlesticks each opening within the body of the previous and closing higher. It appears at the bottom of a downtrend signaling a reversal to the upside.
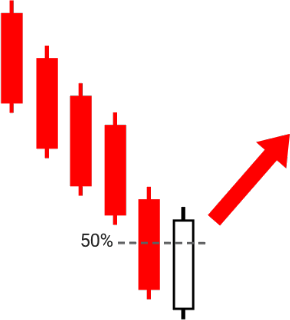
Piercing Line
The Piercing Line occurs at the bottom of the downtrend, signaling a reversal to the upside. It consists of two long candles of opposing color. The first is a long black candle formed in the direction of the trend. The second is a long white candle that gaps lower and eventually closes well into the previous long black body and more precisely above its 50% level.
Moving Average
This is one of the most popular technical tools used in trading the financial markets. It is used to smooth out prices, remove the “noise”, identify the trend, and act as support and resistance. It is calculated as the average price of a financial instrument for a specific number of sessions (i.e. candlesticks). Simply, it is the total of a specific number of closing (this is the default) prices divided by the number of prices. For example, to calculate the 5-period Moving Average of the following prices, the top 5 prices of the table are summed and then divided by 5. Then, the oldest price is ignored, and the next 5 prices are summed and divided by 5. This process continues until the most recent price is included in the calculation.
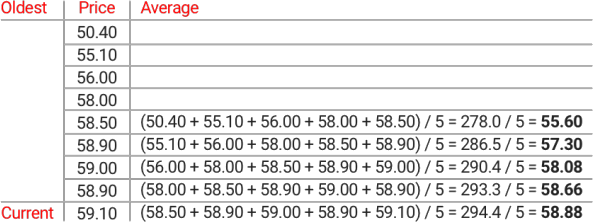
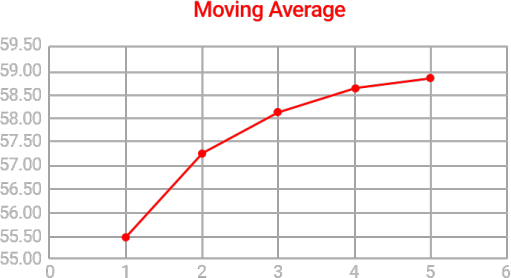
The resulting averages are connected together with a line to form the Moving Average.
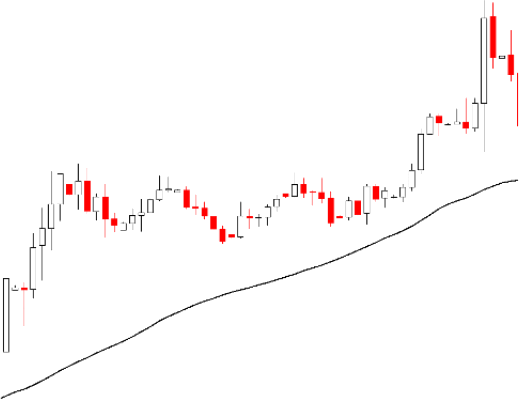
An uptrend is defined when prices are above the Moving Average. Similarly, when prices are below the Moving Average, a downtrend is in place.
Moving Averages come in different “flavors” and methods of calculation:
- Simple or Arithmetic
- Exponential
- Weighted
- Smoothed
- End Point or Least Squares
- Alan Hull
- Arnaud Legoux
- Many other
The primary difference in the above methods is the weight they assign to the most recent prices.
Buy Signal
A Buy signal is generated when prices cross above the Moving Average line.
Sell Signal
A Sell signal is generated when prices cross below the Moving Average.

Relative Strength Index
The Relative Strength Index (RSI) is a momentum oscillator developed to smooth erratic movements caused by sharp price fluctuations and identify overextended prices both to the upside (overbought) and to the downside (oversold). The RSI bounces between 0 and 100. When the RSI crosses above 70, the market is considered overbought and traders are advised to be alert for a reversal.
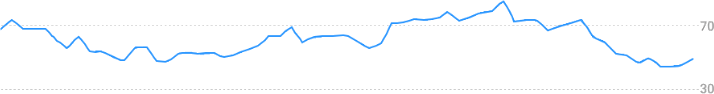
On the other hand, when the RSI crosses below 30, the market is considered oversold and traders are warned to be on the lookout for a reversal in the opposite direction.
Buy/Sell Signals
Both overbought and oversold extremes are best used as filtering tools rather than generating buy/sell signals. A reversal pattern may be considered to be more reliable when the RSI is in the extreme overbought/ oversold areas.